


Advertisement.
While northern jurisdictions have forged ahead with mapping climate-related risks in communities, the Northwest Territories has fallen behind. Here’s where we’re at.
Sara Brown has been waiting to see the territorial government map climate-related threats in NWT communities for more than a decade.
Brown is the chief executive of the NWT Association of Communities, an organization that represents the territory’s 33 communities. Annually, the NWTAC releases a list of resolutions based on what it hears from members to highlight concerns and ask for action at federal and territorial levels.
Advertisement.
Advertisement.
For about a decade, hazard mapping has been on that list.
“It’s very frustrating,” said Brown. “I’ve been known to have little meltdowns in meetings.”
Community hazard maps generally outline areas that are most susceptible to threats related to natural hazards, some of which may increase as the climate warms. The maps might also depict zones that are best suited for development.
With climate change reshaping the North, hazard maps are an important tool for community planning and adaptation.
Advertisement.
Advertisement.
“How do you do community planning when you don’t know where your high-risk areas are?” Brown said.
As an example, she points to Tuktoyaktuk, where houses are being moved away from the eroding coastline. People need to know where to put them instead, Brown said.
Some northern jurisdictions have recognized the value of community hazard maps. In 2016, a team led by the Northern Climate ExChange at Yukon College (now Yukon University) created hazard maps for seven Yukon communities. In 2019 and 2020, another group from Université Laval mapped construction potential in 13 Nunavik communities based on thaw-sensitive permafrost.
Community hazard mapping has also made its way into national standards intended to bolster the climate resilience of northern infrastructure.
Earlier this year, the Bureau de normalization du Québec (BNQ) released guidance on how to develop “land development suitability maps” that show areas best suited for development and those at risk due to climate change.
Most communities in the NWT still lack these types of maps.
Although the territorial government has been working to create community hazard maps since at least 2019, progress has been slowed by technical hurdles and limited resources.
Here’s what has been done so far and why it’s taking so long.
Advertisement.
Advertisement.
What is a community hazard map?
Experts have struggled to agree on what exactly a hazard map is.
At a pan-northern meeting on permafrost hazard mapping in 2018, for example, participants each had a different definition for hazard maps, according to a meeting report.
Depending on the context and purpose as well as a person’s background, hazard mapping “can mean a bunch of different things,” said Ashley Rudy, a permafrost geohazard scientist with the Northwest Territories Geological Survey (NTGS), who was involved in developing the standard published earlier this year.
That’s partly why Rudy and her colleagues decided to use the term “land development suitability map” in the national standard instead, she said.
Generally speaking, though, hazard maps highlight areas where physical processes could cause damage to a community, according to a 2016 Northern Climate ExChange report. They might also include surrounding areas, such as those used for harvesting.
The maps might depict variation in the magnitude, frequency or likelihood of a hazard, such as flooding, permafrost degradation, landslides or coastal erosion, the report states. They can be made for single or multiple hazards.
“It’s all related to negative impacts on people,” said Fabrice Calmels, research chair in permafrost and geoscience at Yukon University.
“What you want to map is a potential negative impact on people using or occupying the land,” he said, adding that this might include areas outside a community that are used for travelling or harvesting.
Advertisement.
Advertisement.
Hazard maps are not the only thing you need to build safely. They’re a starting point, beyond which any building would require a much more detailed investigation before construction began.
To make a hazard map, experts need to understand the processes that define each hazard, according to the Northern Climate ExChange report.
In the context of permafrost, for example, this means not only mapping where frozen ground lies but also assessing its ice content and the texture of sediments to understand the consequences of thaw, Calmels said.
For land development suitability mapping, having communities involved is also crucial as their goals drive what is deemed high risk, according to Rudy and Steve Kokelj, a senior permafrost scientist with NTGS. A given area might be suitable for a baseball diamond, for example, but not a hospital, they said.
Overall, creating a hazard map requires a lot of input from users and technical experts, Rudy and Kokelj said.
It also depends on base information that is largely lacking in the NWT.
What’s been done so far?
For the past few years, the GNWT has been working to gather missing information needed to produce hazard maps, according to Julian Kanigan, an assistant deputy minister at the NWT’s Department of Environment and Climate Change.
That work involves both developing methods and then actually collecting information on hazards such as wildfires, flooding and permafrost thaw, he said.
Advertisement.
Advertisement.
For instance, Kanigan said Natural Resources Canada has developed new guidelines for flood mapping.
“We’re doing some work now to ground-truth that methodology for northern communities that experience ice jam flooding,” Kanigan said, which is different to the kind of flooding common in southern parts of the country.
Ice jam flooding is also notoriously difficult to predict.
Kanigan said the GWNT is working toward new flood inundation maps for Hay River, Fort Simpson and Aklavik – three priority flood risk communities.
Flood inundation maps, which show the maximum extent of the biggest flood on record, are on the low end of the flood mapping hierarchy in terms of analysis and data required, Kanigan said.
He described them as a “first step,” with the end goal being full flood hazard maps. In some cases, however, producing flood hazard maps may be time-consuming, if not impossible, due to a dearth of historical information, he said.
In terms of understanding risks associated with permafrost thaw in the NWT, one missing piece is community-scale surficial geology mapping. These maps show the distribution of different types of materials that characterize surface terrain, such as sediments, organic matter or bedrock. In permafrost regions, surficial materials may also hold ground ice, which is important for understanding the consequences of thaw.
A surficial mapping pilot project has begun in Tuktoyaktuk, according to Kanigan. The project’s aim is to refine an approach that can later be used in other communities, he said.
Advertisement.
Advertisement.
Although the surficial map has yet to be completed, Kanigan said some lessons have been learned. For instance, at the outset of the project, it became clear that there was a need to bring together existing geotechnical and geospatial information for each community, he said.
Over the years, contractors and researchers have gathered geotechnical data for various projects, but that information isn’t readily available, Kokelj said.
To that end, NTGS has been working on a permafrost database that will function as a repository for this type of information, which he said may prove useful for mapping projects.
In addition, NTGS is working with partners to produce surficial maps in four more communities – Aklavik, Fort McPherson, Whatì and Tulita – and will soon be starting in Fort Good Hope, according to Rudy.
But so far, Kanigan said, no communities in the NWT have received finished hazard maps from the GNWT.
While the work is ongoing, some communities have gone ahead with their own mapping efforts.
Roughly a decade ago, Jean Marie River’s Tthets’éhk’édélı̨ First Nation began mapping areas of permafrost sensitive to thaw over roughly 2,000 sq km, encompassing the community and an area used for hunting and gathering, according to an NNSL report at the time.
More recently, Whatì also spearheaded a permafrost mapping project.
Advertisement.
Advertisement.
Expecting community expansion and a need for additional infrastructure following the opening of the Tłı̨chǫ Highway, Whatì senior administrative officer Lisa Nitsiza said she thought it would be useful to know which areas are underlain by permafrost.
Figuring out how to get the mapping done involved “a lot of hoop-jumping,” Nitsiza said. In 2019, however, she connected with Seamus Daly – then a student at the University of Lethbridge – who mapped permafrost throughout the community.
“We stopped short of creating an actual hazard map,” said Daly, now a research coordinator with Aurora Research Institute.
“Our map isn’t saying anything other than where the permafrost is.”
Nonetheless, Nitsiza said the information will be useful for deciding where to build and finding the right site for a new cemetery, as the current cemetery is filling up.
She said she hopes to avoid permafrost-related issues such as those seen in a cemetery in Behchokǫ̀.
“We’re trying to learn from that,” she said.
Why has progress been slow?
According to Kanigan, there are multiple ways to produce hazard maps. Although the approach the territory is using will take time, “it’s going to produce a product that we can use and that is helpful,” he said.
Advertisement.
Advertisement.
Kokelj and Rudy similarly said that building up the missing information is a resource-intensive and time-consuming process.
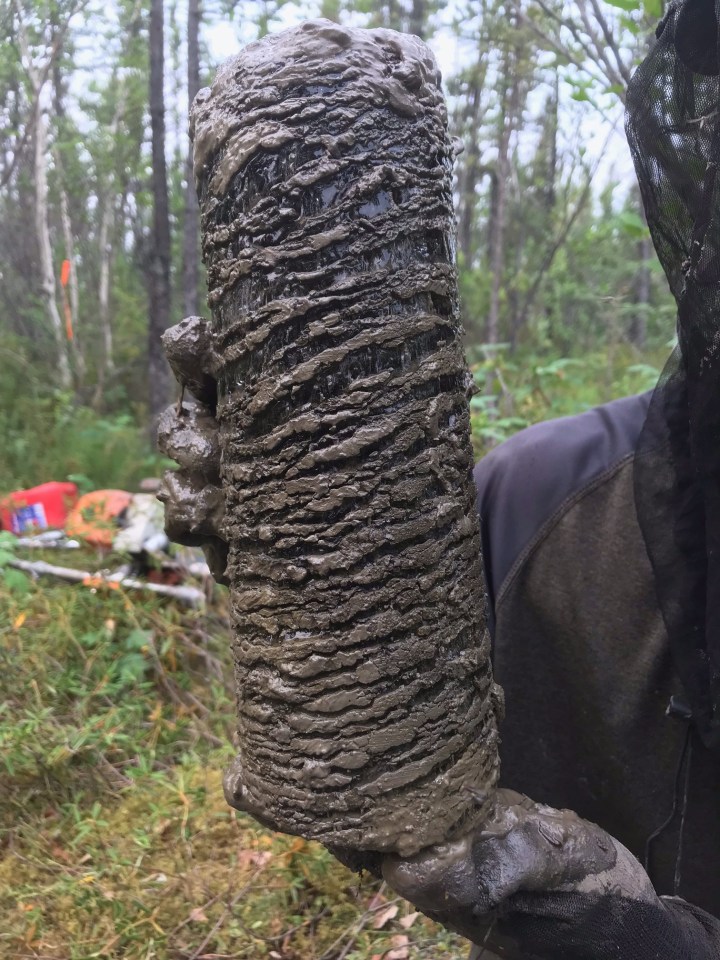
Surficial mapping, for example, ideally involves fieldwork to make sure that remotely sensed data really reflects what’s underground, according to Alexandre Chiasson, a PhD student from the University of Alberta and an intern at the geological survey. He said fieldwork can also help delineate ice-rich areas.
Last summer, Chiasson spent roughly 10 days conducting fieldwork and drilling boreholes in Tulita with community members and a team from the University of Alberta. They found ice-rich permafrost where Chiasson didn’t expect it – something they would have missed if they had been mapping entirely remotely, he said.
This summer, Chiasson, the University of Alberta team and NTGS will be wrapping up the work in Tulita and starting in Fort Good Hope.
To do the same thing in the NWT’s 33 communities would take a lot of time, money and people, Rudy said.
As a point of comparison, she said it took the Yukon Geological Survey several years to produce Yukon’s hazard maps. Yukon also had a team of three technical experts doing all the fieldwork and mapping, she added.
In the NWT, Rudy said there are more communities than in the Yukon, the permafrost is more variable, and the communities are harder to access.
Meanwhile, the NTGS doesn’t have dedicated resources or staff to handle surficial mapping, Kokelj said.
Advertisement.
Advertisement.
“If completing geohazard mapping for communities is deemed to be important, then that has to change,” Kokelj said.
In fact, surficial mapping in some NWT communities is being done remotely as resources and capacity are limited, Rudy and Kokelj said.
According to Kanigan, funding has also been a barrier – but more opportunities are opening up.
With additional federal support, Kanigan said the GWNT is looking to hire a community hazard mapping coordinator to speed up the work.
Asked when community hazard maps might be ready, Kanigan wouldn’t give any specifics, although he said the inundation maps are expected to become available this year.
Brown, from the NWTAC, hopes to see maps soon.
She said having communities become experts and produce the maps individually is inefficient.
Although Brown acknowledged that filling in missing information requires extra work, she said that explanation can only stand for so long.
“We can’t be here five, 10 years later,” she said. “There are decisions that are being made now that will resonate for hundreds of years.”
This article is produced under a Creative Commons CC BY-ND 4.0 licence through the Wilfrid Laurier University Climate Change Journalism Fellowship.