


Advertisement.
Researchers are putting together the first map of Northwest Territories land features caused by permafrost thaw.
The project highlights the diversity of ways permafrost is changing throughout the NWT, which the researchers say will foster a deeper understanding of permafrost thaw and its consequences for communities and the environment.
Permafrost is defined as ground that remains at or below 0C for at least two years. Beyond its temperature, however, permafrost can also be characterized by its distribution, thickness, material properties, ice content and the landscape’s history, said Steve Kokelj, a permafrost scientist who is leading the work with the NWT Geological Survey (NTGS).

All these factors combine to create different landforms, Kokelj said during a presentation at the Yellowknife Geoscience Forum on Tuesday.
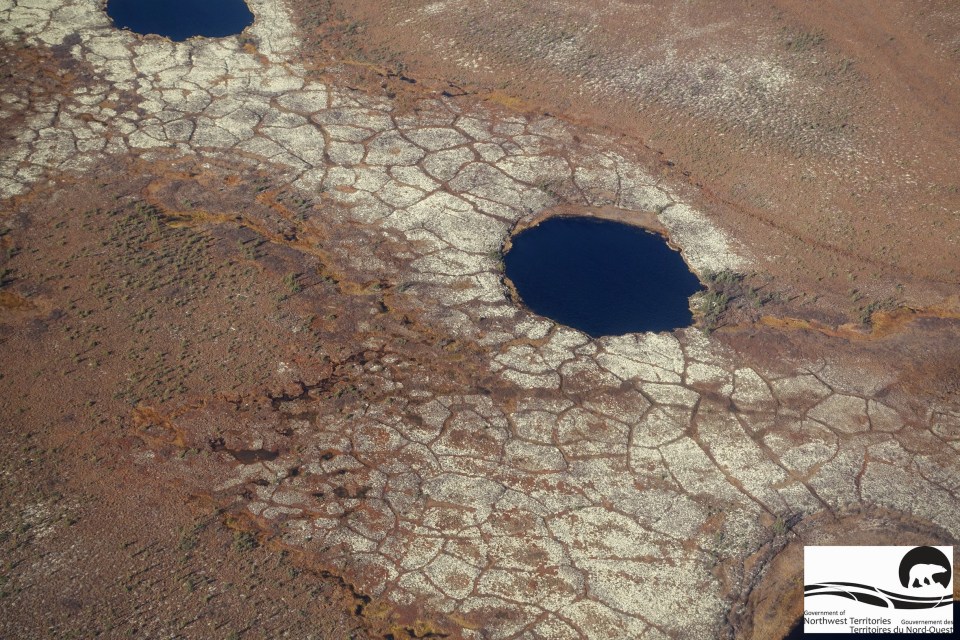
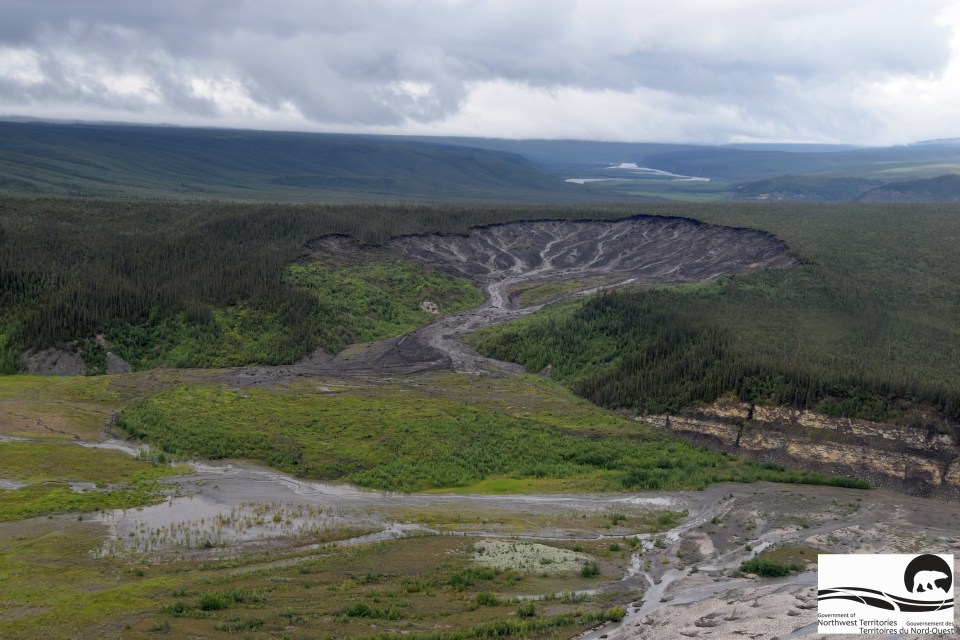
Ice-wedge polygons, for example, occur when the ground cools and contracts, allowing the cracks to fill with water in the spring, creating veins of ice that eventually form a honeycomb pattern over the landscape. As permafrost thaws, ponds form over this polygonal pattern. Meanwhile, retrogressive thaw slumps – landslides that grow as thawed ground moves downslope – often indicate melting ice left over from the last glaciation, Kokelj said in interview with Cabin Radio earlier this month.
“You can think of permafrost as having personalities,” he said. “Its personality will dictate how it’s going to respond when it thaws.”
Although researchers know that permafrost is changing in a wide range of ways, precisely how that change varies in different parts of the North is not yet clear.
Advertisement.
Advertisement.
“We don’t have depictions on how these types of changes are manifesting themselves across the landscape,” Kokelj said.
Existing permafrost maps tend to portray differences and changes in permafrost in broad strokes, on a national or circumpolar scale.
According to Kokelj, these depictions have limited our understanding of the changes actually taking place.
“The story has been so simple so far, but it’s because the way that permafrost thaw is characterized has been so simple,” he said.
Fifty shades of permafrost
In 2019, Kokelj and his colleagues set out to bring more nuance to the field. They started the NWT Thermokarst Mapping Collective, a project involving scientists from various governments and academic institutions that aims to map thermokarst features and indicators of sensitive terrain throughout the territory. (The word “thermokarst” refers to the process by which permafrost thaw causes the land to subside, leaving distinctive features on the landscape.)
The project represents the first inventory of thermokarst features throughout the territory, said Seamus Daly, a spatial analyst and coordinator with Wilfrid Laurier University and the mapping project’s manager. “By looking at the whole territory, you’re just looking at a lot of places that people haven’t looked before,” he said.
Kokelj says the mapping also stands out because northerners have been instrumental in spearheading the work and gathering data.
At the project’s outset, he and his colleagues created a list of landscape features they wanted to map, such as thaw slumps, shallow landslides, rock avalanches, drained or discoloured lakes, polygonal terrain caused by ice wedges and pond-covered polygonal terrain.
Advertisement.
Advertisement.
The nice thing about permafrost, Kokelj said, is that its characteristics manifest in ways that can be seen at the earth’s surface. As the climate warms, these characteristics are being expressed more vividly.
Using satellite imagery, the team split the territory into 7.5 km by 7.5 km grid squares. A team of mappers then examines the squares, identifying which thermokarst features are present in each one. The mappers also make note of the features’ abundance and size or relative cover.
Four years into the project, progress has been slow, Kokelj said. Because there are more than 30,000 grid squares to scrutinize, the team has focused on areas around communities and in the western Arctic. So far, they are about a third of the way through the mapping.
Building better questions
Still, the resource is already proving insightful.
Thaw slumps – features that tend to grow chronically year after year – are generally concentrated in some northern regions, Ashley Rudy, a permafrost geohazard scientist with NTGS said in another presentation on Tuesday. Farther south, however, deep-seated failures that move massive amounts of material within about a day are more common. Kokelj suspects these types of failures are only occurring where permafrost is thin.
The map might also be useful for validating other permafrost maps generated through modelling, Daly said. Although not the main goal of the project, having a map based on observations can enable researchers to compare what modelling studies predict to what mappers are seeing on the landscape. “It might be exactly what they said, or might be very different,” Daly said.
On Tuesday, Kokelj presented preliminary results from these types of comparisons.
In some cases, the maps Kokelj and his colleagues created are drastically different than those created through modelling. The team’s map of thaw slumps in the western Arctic, for example, aligns poorly to the modelled distribution of susceptibility to landslides reported in a 2016 study. The two maps “don’t even come close to telling the same story,” Kokelj said.
Advertisement.
Advertisement.
The preliminary findings suggest that the project adds to our current understanding, Kokelj said.
Going forward, he thinks the data will help scientists frame informed, focused studies, and better understand how permafrost in various parts of the territory is likely to change – and the consequences.
Without that background information, he said, it’s hard to ask good questions.
This article is produced under a Creative Commons CC BY-ND 4.0 licence through the Wilfrid Laurier University Climate Change Journalism Fellowship.