


Advertisement.
Thousands of Northwest Territories evacuees have a new task in their daily routine: check a fire map to see if their community is doing OK.
On Facebook, residents of Yellowknife have posted screenshots of hotspot maps, calculating the distance between the city and the nearest fires.
All summer, evacuees from many communities – there have been around a dozen evacuation orders, all driven by wildfires – have searched for the best way to instantly tell what the threat to their home looks like, even while the NWT’s wildfire agency issues updates at least daily.
Cabin Radio’s own fire map has received 81,671 hits since August 16, the day Yellowknife’s evacuation order went out, representing nearly 70 percent of the page’s total views since its creation on July 26.
Advertisement.
Advertisement.
The heightened focus on fire maps has also caused some confusion.
At times, people have posted inaccurate distances between Yellowknife and the nearest fires. Others have questioned the accuracy and timeliness of information shown on certain maps – including our own.
Although fire maps can be useful tools for gaining awareness of fire activity, they have limitations, according to Bruce Macnab, head of wildland fire information systems at Natural Resources Canada’s Northern Forestry Centre.
For instance, a hotspot’s absence doesn’t necessarily mean a fire is out, and hotspots are not exactly where they appear on a map.
Advertisement.
Advertisement.
“I think they’re a good awareness tool,” Macnab said of fire maps. But you can’t rely on the data without taking in the knowledgeable advice and interpretation of professionals from the territorial fire agency, he said.
Given the importance of fire maps in NWT residents’ lives at this time and the questions they may raise, here’s what users should keep in mind.
What do online fire maps show, and what are they based on?
There are a few different online fire maps to choose from.
Those we’ve seen NWT residents use most commonly on social media include Nasa’s Fire Information for Resource Management System (or Firms), the Canadian Wildland Fire Information System (CWFIS) interactive map, our own NWT fire map, a map from Windy.com and the GNWT’s live fire map.

Many of these maps show hotspots. According to Natural Resources Canada, a hotspot is “a satellite image pixel with high infrared intensity, indicating a heat source.” Often, a hotspot signifies fire.
Information about hotspots is largely collected by instruments on satellites, such as VIIRS and MODIS.
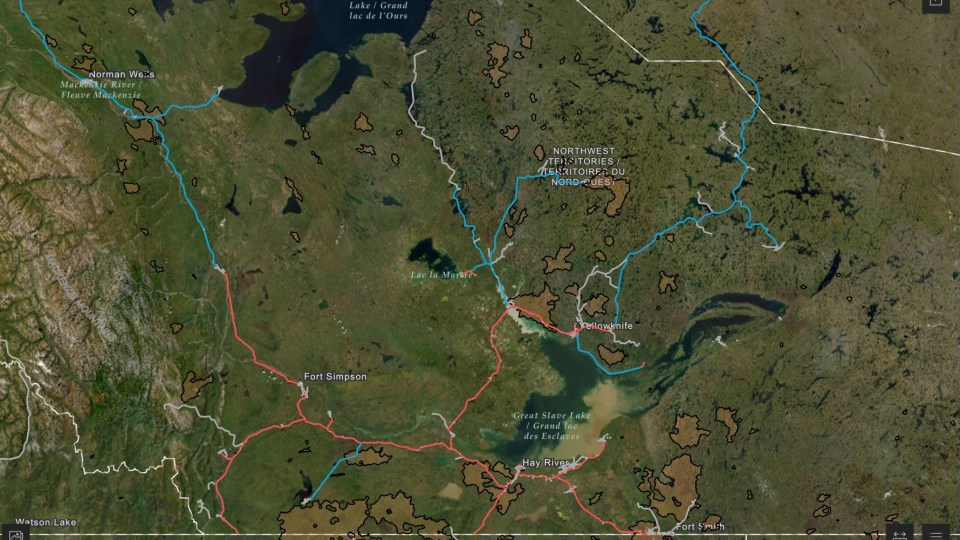
The GNWT’s live fire map shows fires that are active or out, including their name, start date, size and control status. (Some people have noted that the GNWT’s live fire map is not up to date, and the hotspot layer appears to be broken. Cabin Radio reached out to NWT Fire but did not hear back before publication.)
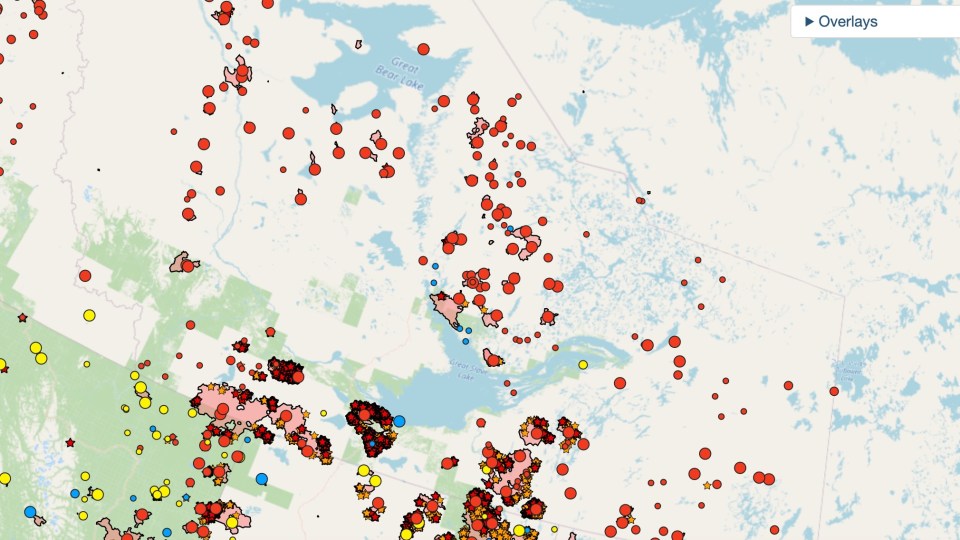
Like the GNWT’s map, the CWFIS map has an “active fire” layer, which shows information drawing on data provided by fire management agencies, including NWT Fire.
Advertisement.
Advertisement.
Fire perimeter is available on some maps, such as CWFIS and Cabin Radio. On the CWFIS map, fire perimeter is determined based on seasonal hotspots to date. Natural Resources Canada warns that this information represents a rough estimate, best suited for large fires.
The fire perimeters depicted on Cabin Radio’s map similarly come from the CWFIS via ESRI Canada, a geographic information system company.
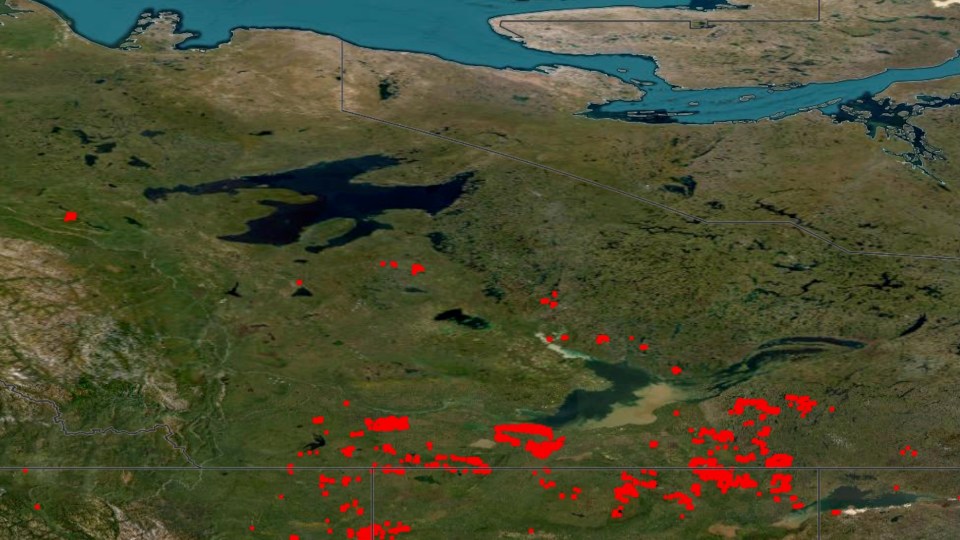
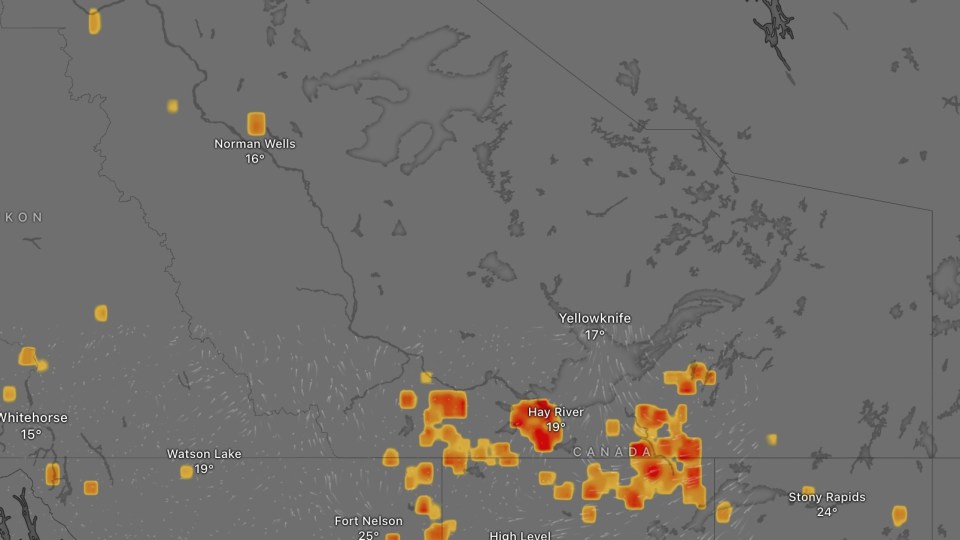
The Windy fire intensity map, meanwhile, is a bit of an outlier. It shows fire radiative power – a measure of radiant energy released over time by a fire, collected by satellite-based sensors.
What causes inconsistencies between maps?
When it comes to fire maps, Macnab said the goal is to produce the most consistent information. But this can be a challenge.
Data sources used to create maps can vary, he said, and in many cases, there is also variation in the methods used to process and display that data on a map.
“They’re never going to be exactly the same,” he said.
Regarding the CWFIS map, Macnab added that Natural Resources Canada provides information to a variety of users, including the RCMP, Canadian Armed Forces, and provincial and territorial agencies.
“We’re playing a bit of a balancing act,” he said. “You want to provide people consistent information, but you also don’t want to hold back information that may be appropriate for some.”
Advertisement.
Advertisement.
Some maps also differ in their resolution. The Windy fire intensity data is collected in 10-kilometre grid cells, for example, while the CWFIS and Nasa maps have a roughly one-kilometre resolution at their lowest.
Although Macnab wouldn’t comment on whether some maps are more accurate than others, he said that fire maps are often similar, especially when it comes to hotspots.
What are fire maps’ limitations?
Satellite-based fire maps are useful, but they aren’t perfect.
Firstly, users should know that Cabin Radio’s map is considered experimental, as none of our staff has expertise in fire mapping. NWT resident Anthony Castillo, who created the map by pulling in relevant data from different sources, said he has “zero knowledge in mapping.”
Even when maps are developed by experts, regularly updated and glitch-free, they have limitations.
According to Macnab, one major challenge is that hotspot-detecting satellites can’t see through heavy smoke or clouds.
Over the past few days, both heavy clouds and smoke have hovered over the NWT, Macnab said, which has made it particularly difficult to gather accurate information on fire locations.
“We kind-of had a bit of a dead zone, at least in terms of remote sensing,” he said in an interview on Wednesday.
Advertisement.
Advertisement.
Even when skies are clear, though, Macnab said satellites can only provide an estimate of a hotspot’s location. As satellites pass over an area, he explained, they capture an image of the Earth from a certain angle. As a result, the location of a hotspot shown on a map can be a few hundred metres away from where it actually is on the ground.
“Occasionally, for example, [a map will] show a fire has jumped a road that it may not have quite jumped, just because of the margin of error,” Macnab said.
In addition, hotspot maps may not show fires burning below ground. According to Macnab, a bit of rain can push a fire below the surface. But the fire can quickly pick back up when conditions are ripe.
“Just because a hotspot doesn’t show up today, doesn’t mean the fire is out,” he said, adding that hotspots may disappear for four or five days due to cloud cover, smoke or slight rain.
Conversely, maps may sometimes show a hotspot where there isn’t really a wildfire burning –an error known as a false positive. For instance, bright sunlight reflecting on bare rock, or industrial or agricultural burning, can confuse satellites’ sensors.
Agencies try to remove these errors from maps, Macnab said, but some may still slip through.
More broadly, wildfire-detecting satellites are also not ideal for spotting fires in northern regions as they tend to be biased toward collected data closer to the equator and the temperate zones.
In the North, Macnab said, “we’re not getting as many attempts to capture hotspots.”
Advertisement.
Advertisement.
This has been a challenge for fire managers. For several hours each afternoon and early evening, none of the satellite images they need are available. This chunk of time, known as the “peak burn period,” is when wildfires are usually most active.
A federal initiative is aiming to address this gap.
Natural Resources Canada, the Canadian Space Agency, and Environment and Climate Change Canada are working to build a fire monitoring satellite to support fire managers and provide data they can use operationally. Called WildFireSat, the satellite is scheduled to launch in 2029.
“WildFireSat will, among other things, allow for better, quicker, more timely information, particularly in the northern parts of the provinces and the territories,” Macnab said.
How should you use fire maps?
Overall, Macnab said, people can have “a fair amount of confidence” in wildfire maps.
He said fire maps can be used to gain awareness of fire activity and a sense of risks. At the same time, he said, they are just one piece of information – and he advised against using them for life-or-death decisions.
NWT Fire’s updates should be the number-one source of information for decision-making, according to Macnab. He said the most important thing is to know what your local jurisdiction is asking you to do, and what areas they say are open or safe.
“They’re the ones in charge, but they’re also the ones on the ground,” he said of the territory’s fire agency.
“You can only do so much from remote sensing from satellites.”