


Advertisement.
It’s the news nobody wants but any resident knows: parts of the South Slave and Dehcho are even drier this year and seeing barely any snow.
Snow on its own doesn’t solve a drought – for a start, the type of snow plays a role in how much moisture actually stays behind.
But an absence of snow certainly doesn’t help. By any measure, Hay River, which was evacuated twice last year because of nearby wildfires, is extremely dry and getting no help from winter.
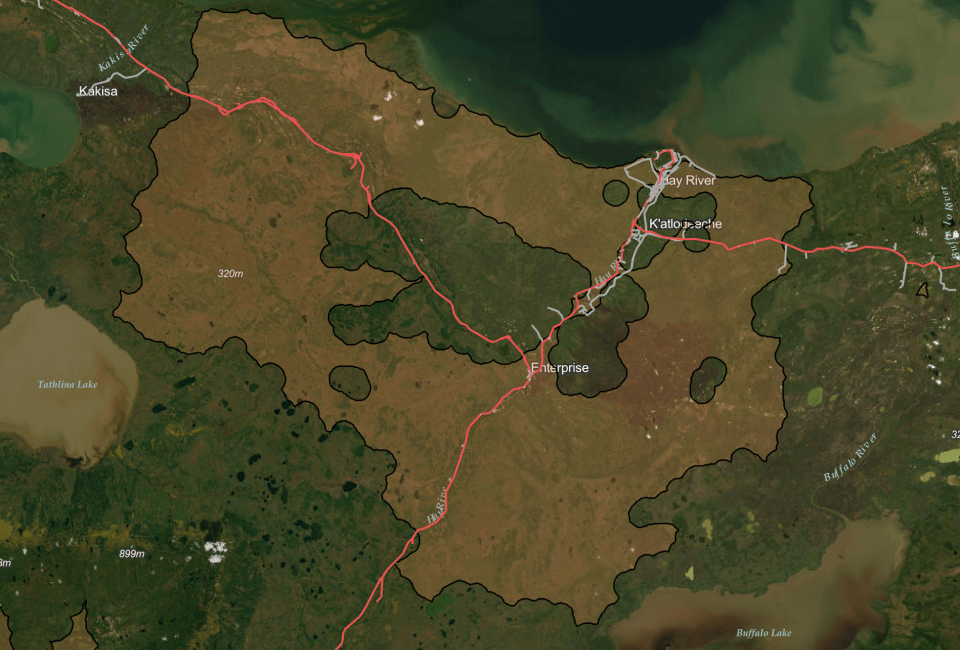
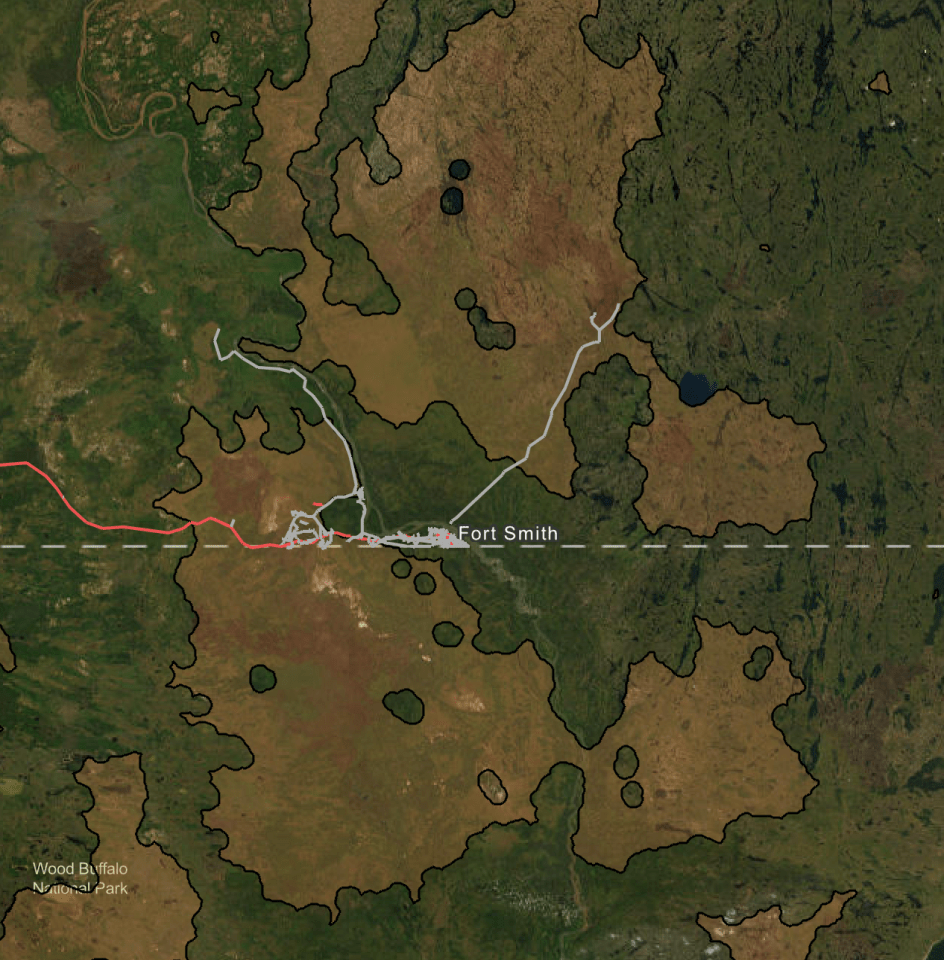
While a vast wildfire burned hundreds of thousands of hectares around Hay River last year, burn area maps suggest pockets of unburned forest remain, as they do to the north and east of Fort Smith (which was also evacuated in 2023 because of separate fires).
Advertisement.
Advertisement.
In Fort Simpson, which didn’t face a wildfire threat last summer and where residents worry about what would happen if a fire came close, there’s been very little snow.
Beyond wildfire danger, the ongoing drought has implications for wildlife habitat, hunting and trapping, agriculture, hydro power generation and the transportation of goods by barge, which was heavily disrupted in 2023.
Most of the South Slave was considered to be in “extreme drought” by the end of January. Yellowknife, which has had roughly average snowfall this winter, is still in “severe drought” according to the Canadian Drought Monitor, a federal guide.
On Thursday, the NWT government issued its latest water monitoring bulletin with charts that show the current state of key rivers and lakes.
Advertisement.
Advertisement.
Here are some of the GNWT charts that tell the story.
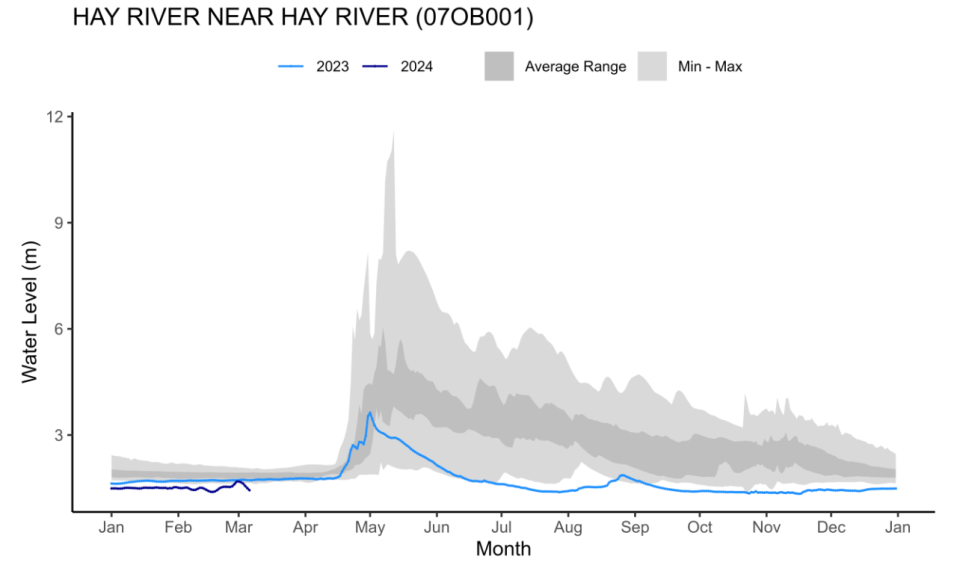
Here’s how to read these water level charts: look for the dark blue line on the bottom left.
The lighter blue line is 2023’s water level throughout the whole year. Since we’re only in March, the dark blue line that represents 2024 has only made it a small way across the chart.
The light grey shows the absolute minimum and maximum values throughout all years of data before 2023. The dark grey shows the rough range for an average year. If a line is in clear white space below the grey, that means the water level is so low that it’s setting records.
The chart above shows the Hay River’s water level near the town. Since about June last year, that water level has been at or near its lowest in history, and that’s continuing into 2024.
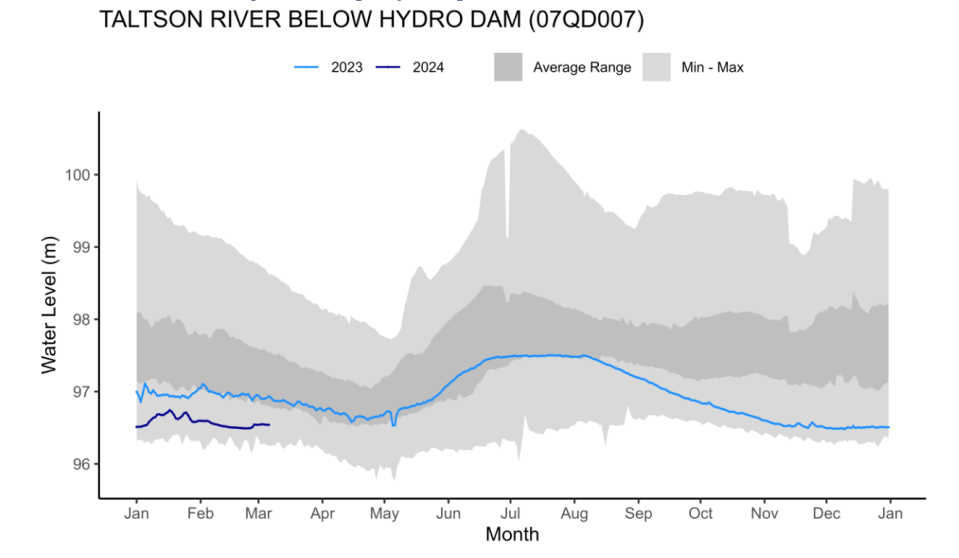
The Taltson River below the hydro dam, north of Fort Smith, isn’t quite as low – compared to other years – as the Hay River.
Even so, it’s still lower than it was last year and near the low edge of what’s been seen before.
This chart tells a pretty stark story.
Advertisement.
Advertisement.
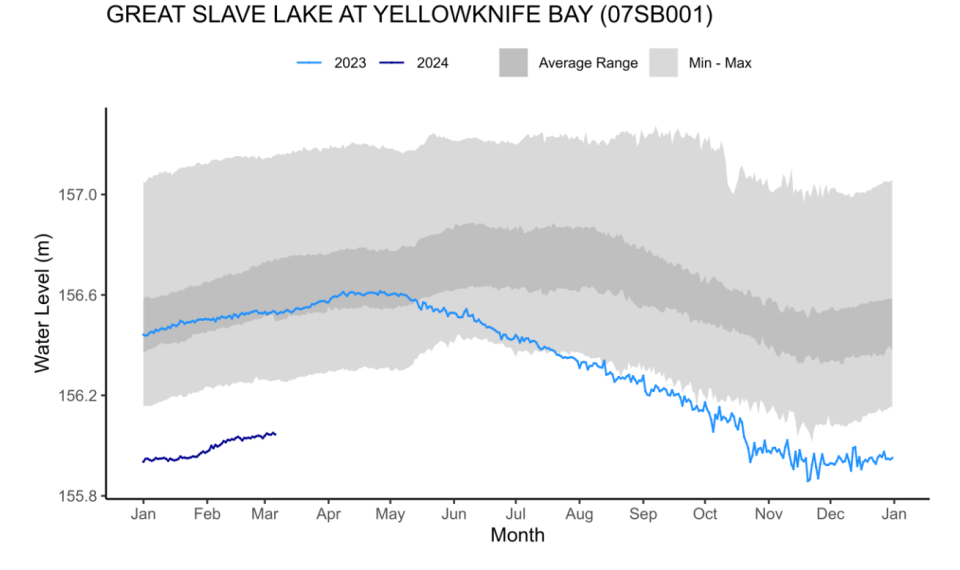
The water level of Great Slave Lake in Yellowknife Bay is really, really low by the standard of previous years.
The data was fairly normal till May last year, then the water level tanked and hasn’t meaningfully recovered.
“Water levels across most of the NWT remain very low,” the GNWT stated in a summary accompanying these charts.
“The Slave River has been below average over the fall and has remained that way through winter. Great Slave Lake remains at the lowest water level ever recorded for this time of year.”
Great Bear Lake, too, is at or near its lowest recorded level for the season.
So how much snow are different places getting that might help water levels once the spring melt kicks in?
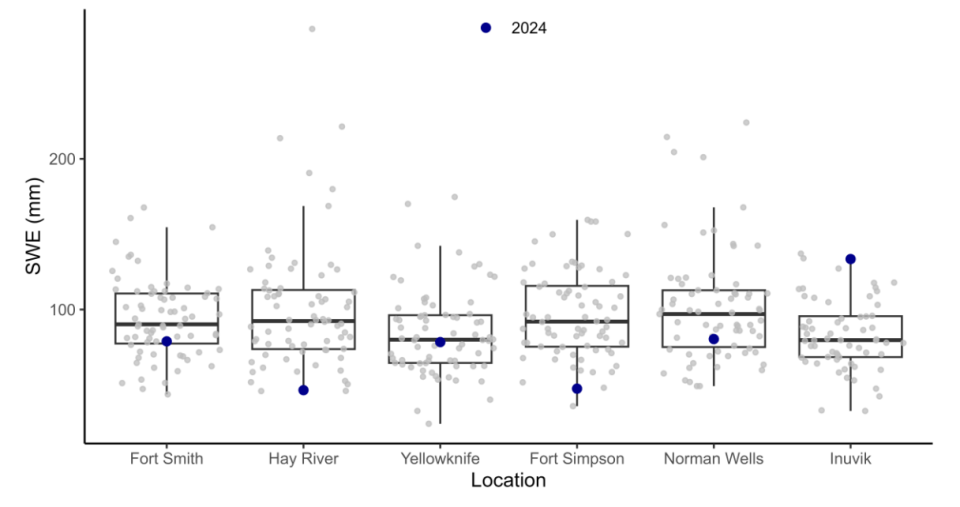
This is a type of chart known as a box plot. It’s showing snow water equivalent (labelled as SWE), which is the amount of water that would remain if fallen snow melted, based on the snow recorded for the last three months of 2023 and the start of 2024.
The blue dots show each community’s figure for late 2023 and early 2024. The grey dots are figures for the same period in previous winters. (The boxes and thick black line represent the zone in which an average year might land.)
Advertisement.
Advertisement.
The chart shows that Yellowknife’s snowfall this winter would be expected to deliver about as much water as any other year. Inuvik, seen on the right, has had near-record snow.
Hay River and Fort Simpson, though, have blue dots near the bottom end of the spectrum. Those communities haven’t had nearly as much snow as they would normally expect.
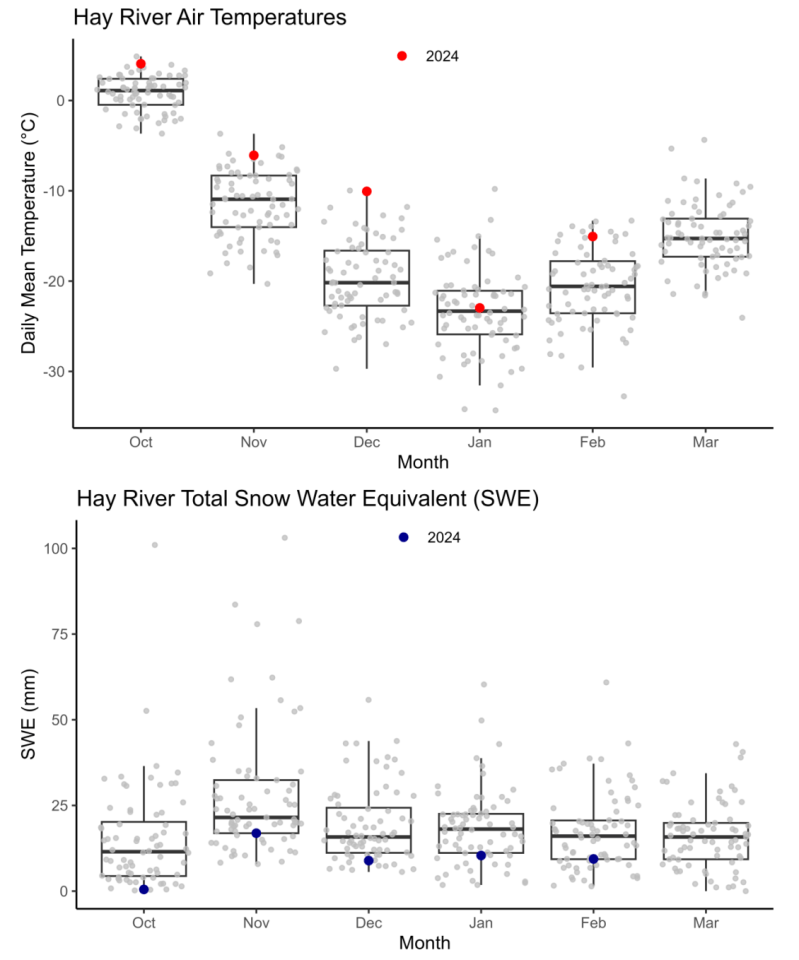
Here’s a closer look at Hay River.
You can see from the bottom chart, with the blue dots, that there hasn’t been a single month this winter in which Hay River hit a regular level of snow water equivalent.
Look at the top chart and you’ll see the town has also been posting above-average air temperatures this winter, month after month.
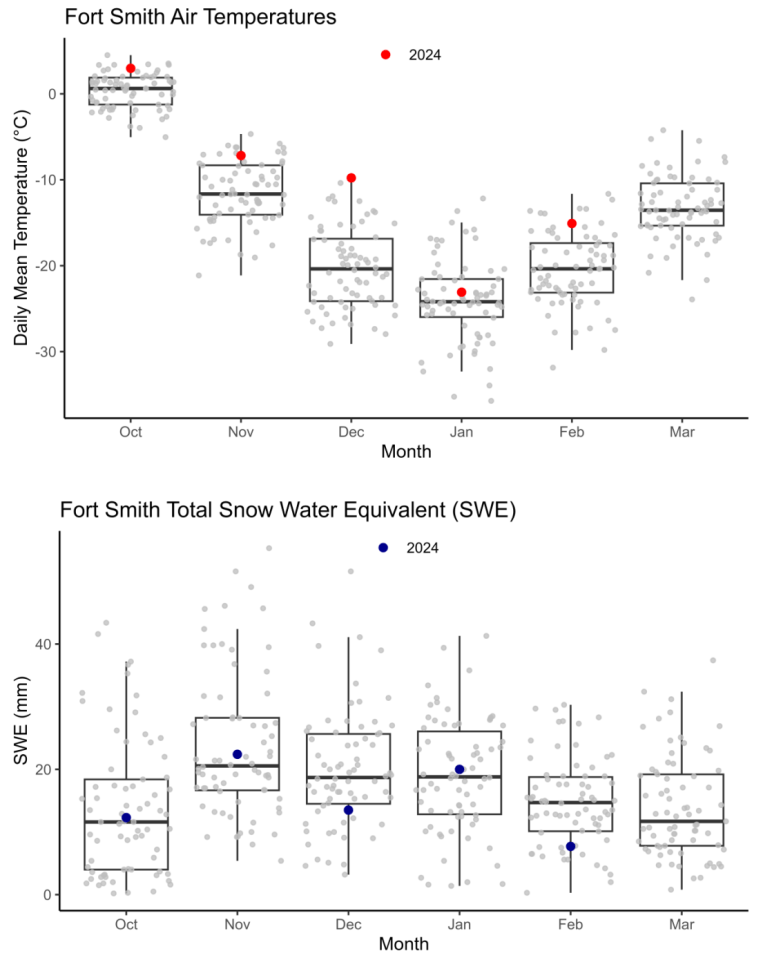
Fort Smith has been similarly warm, as the top chart above shows.
However, Fort Smith has at least had the benefit of reasonable if unspectacular snowfall in October, November and January.
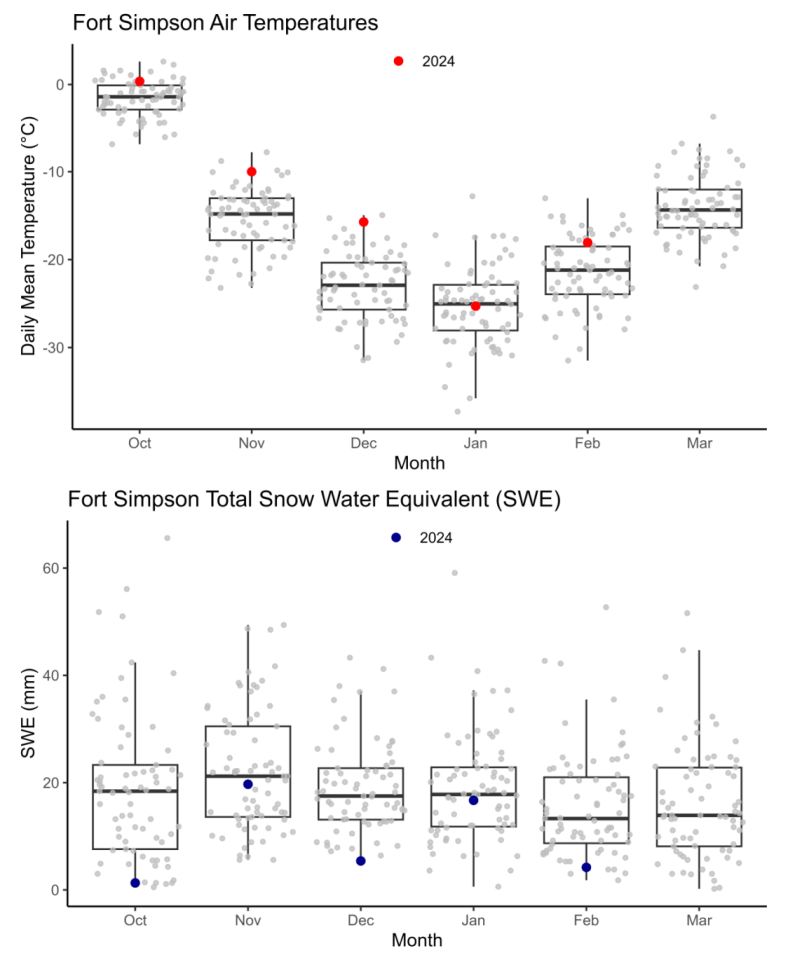
Fort Simpson’s snowfall picture isn’t quite as dire as the Hay River chart, but it’s not far off.
Advertisement.
Advertisement.
November and January came close to being average months for snow in the village. October, though, was near to the record low for snow water equivalent, and December hit record-setting territory. February wasn’t much better.
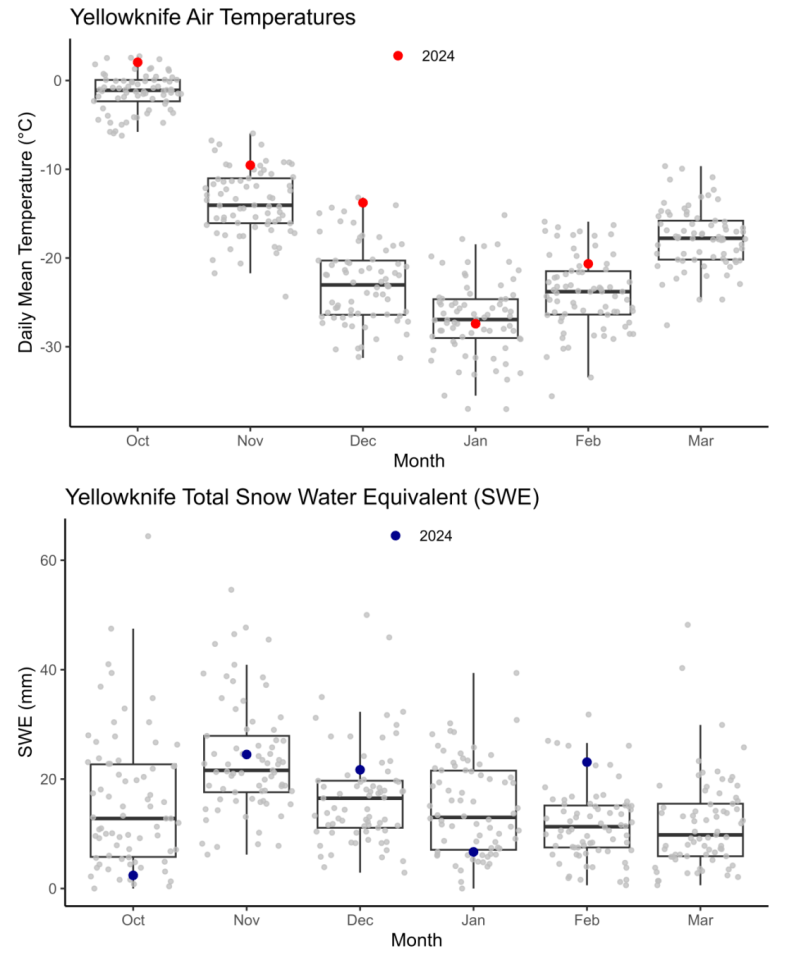
If you thought January was a cold one in Yellowknife – yes, it was colder than the months around it, but in the context of prior decades it was basically average.
Other months, however, have been warmer than usual. December, in particular, was almost the warmest December Yellowknife has ever seen.
The snow picture isn’t as bad in Yellowknife as it is to the south.
January and October were fairly snow-free, but February more than made up for that.
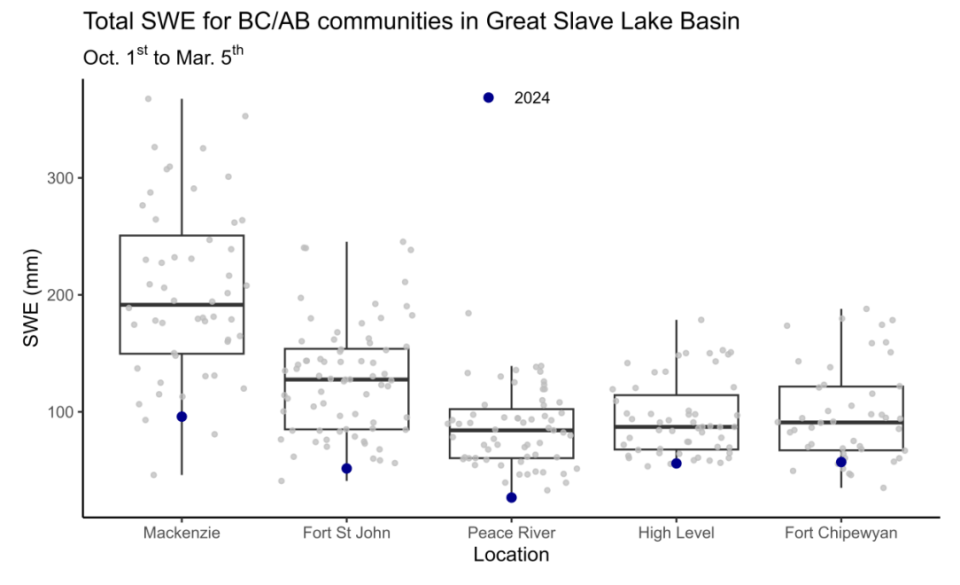
Speaking of the south, here’s the snow picture in northern Alberta and BC.
These are all areas within the Great Slave Lake basin.
The blue dots show that in the communities where water flows north into the NWT, there’s very little snow water equivalent ahead of the spring melt (unless March and April bring vast dumps of the stuff).
Advertisement.
Advertisement.
That means we can’t necessarily look to the south for a big push of water into local river systems.
That could be good news from a flooding perspective – ice jam flooding remains a risk no matter the water level, because of its unpredictability, but high water levels can make its effects worse.
But the bottom line for the coming fire season, as the territory’s premier has already warned, is that residents would be wise to expect another tough summer.
You can see the full GNWT water monitoring bulletin and more charts on the Department of Environment and Climate Change’s website.