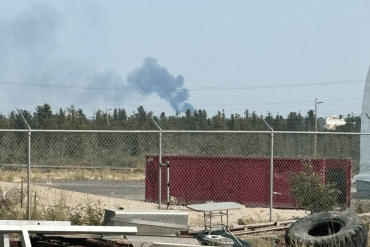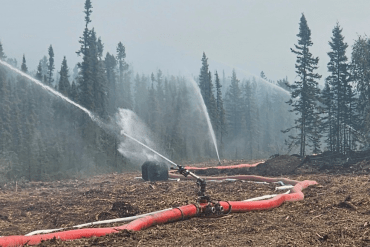
A "carefully planned" intentional fire was set north of Wrigley on Tuesday in a bid to protect the Dehcho community from a wildfire five kilometres away.
Advertisement.

Air Quality
Click on a dot anywhere on the map to see the latest PurpleAir air quality measurement and how the air rates, plus a graph showing how the air quality has changed in recent days.
Air
Click on a dot anywhere on the map to see the latest PurpleAir air quality measurement and how the air rates, plus a graph showing how the air quality has changed.
Wildfire coverage
Our latest coverage of the wildfires causing some of the NWT's air quality concerns.