


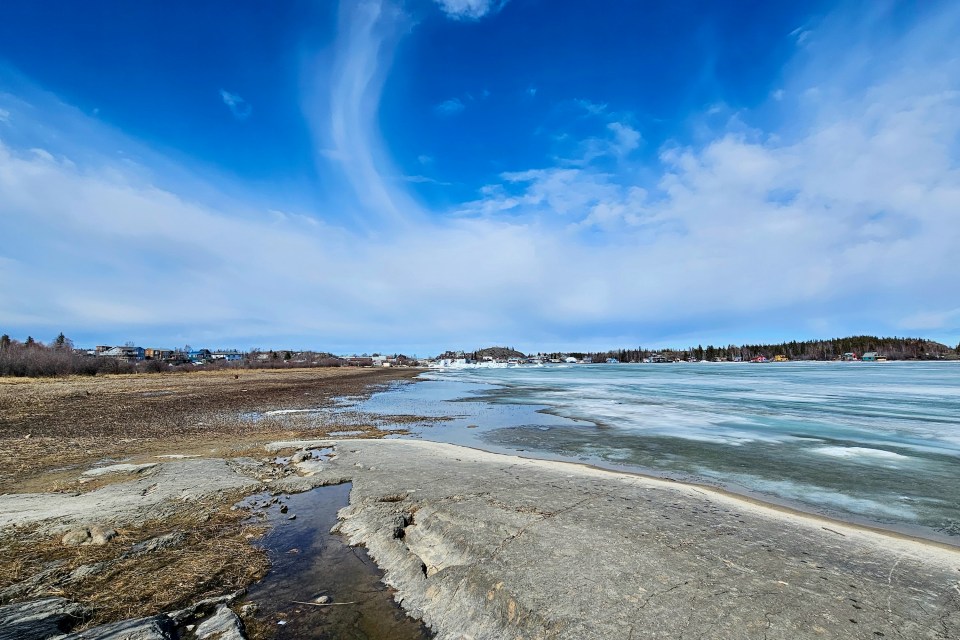
If you think you’ve never seen Yellowknife Bay this low, you’re right. You never have.
Here’s the latest chart of Great Slave Lake’s water level at the bay beside Yellowknife, published by the NWT government on Wednesday.

The dark grey is the average water level in the bay for the time of year. The light grey is the full range of values, from the lowest to the highest, ever recorded in Yellowknife Bay before 2023.
Light blue shows 2023, and you can see the water level on the bay start to steadily drop from May 2023 onward.
It bottoms out in December, then it becomes the dark blue line for 2024.
Advertisement.
Advertisement.
You can see the dark blue line gradually increase, which means the water level is rising again. But compared to every other year (all of the grey area), Yellowknife Bay’s current water level isn’t just a record, it’s “much lower than the previously recorded lowest value,” according to a water monitoring bulletin from the GNWT this week.
Sure, the water level is a little higher than it was over the winter, but only with the spring melt and the snow vanishing is the contrast between this spring and any other year becoming apparent.
Here’s another chart. This time, we’re looking at the fluctuation of Yellowknife Bay’s water level all the way back to 1940.

You can see the lake’s water level go through phases. Particularly obvious is the annual cycle of low to high water, which creates the regular dips and spikes.
Advertisement.
Advertisement.
There are bigger, more gradual forces that you can see at work, too, causing the bay water level to ease up for a few years then ease back down.
Then you get to the 2020s, and the chart goes haywire.
Let’s zoom in and just run the chart from 2014 to 2023.

This allows you to see the regular ebb and flow of the bay – much the same as any decade in the chart above – which then hiccups a bit in 2019 and astronomically soars in 2020, remaining extremely high through 2021 and into 2022.
Then the water level falls off the edge of a figurative cliff, plunging in the back half of 2022 and through most of 2023.
NWT hydrologists say this extreme swing – all the way up to a record high then almost immediately down to a record low – is unprecedented in the data for the lake, and you can see that in the graph stretching back to 1940, which is roughly when Yellowknife started to be a thing. There’s no sequence of years quite like 2020-2023.
In the coming days, watch out for more reporting from Cabin Radio on the causes behind some of the fluctuations we’re seeing.
And of course, it isn’t just Yellowknife. You can check out our coverage of low water levels in the Dehcho and South Slave, too.