

Advertisement.
As drought conditions persist, the NWT government says water levels and flow rates remain low across much of the territory.
The NWT’s Department of Environment and Climate released its latest monthly water monitoring bulletin this week.
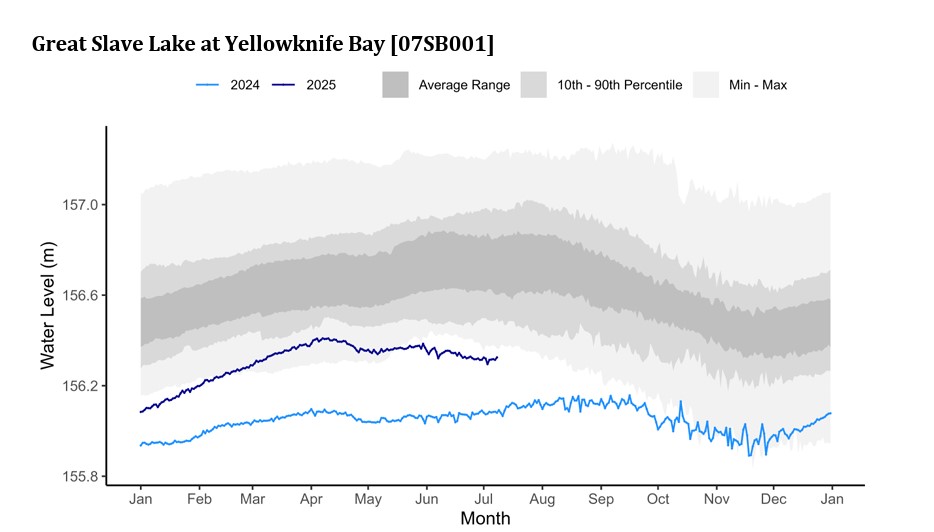
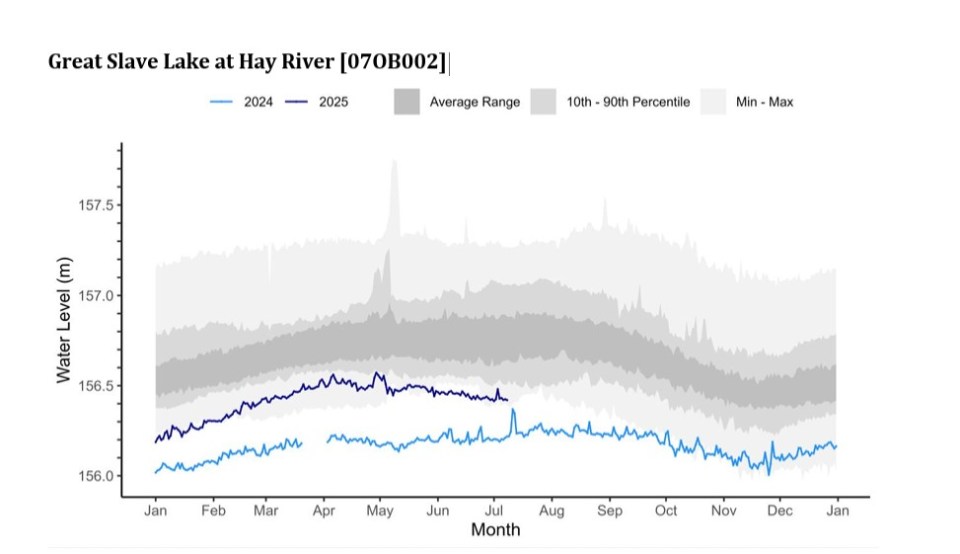
It states that the water level on Great Slave Lake continues to be “well below average” and has been slowly decreasing throughout the month.
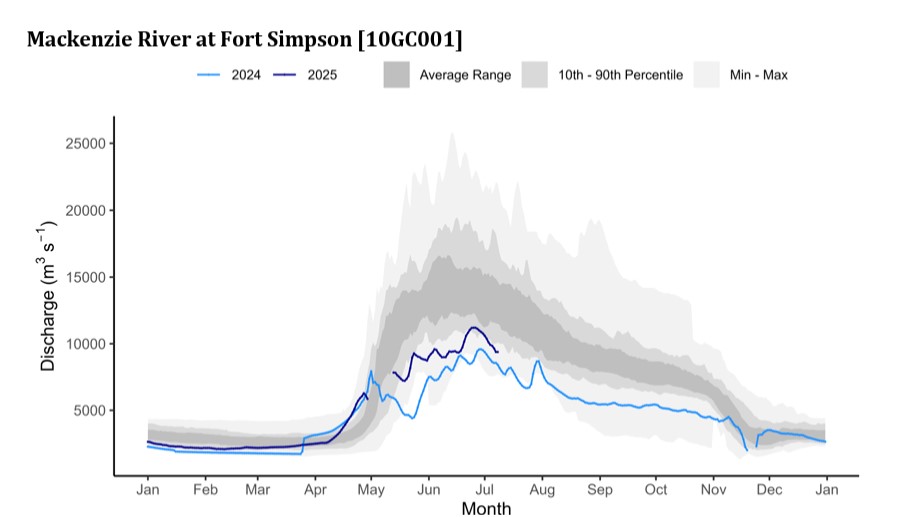
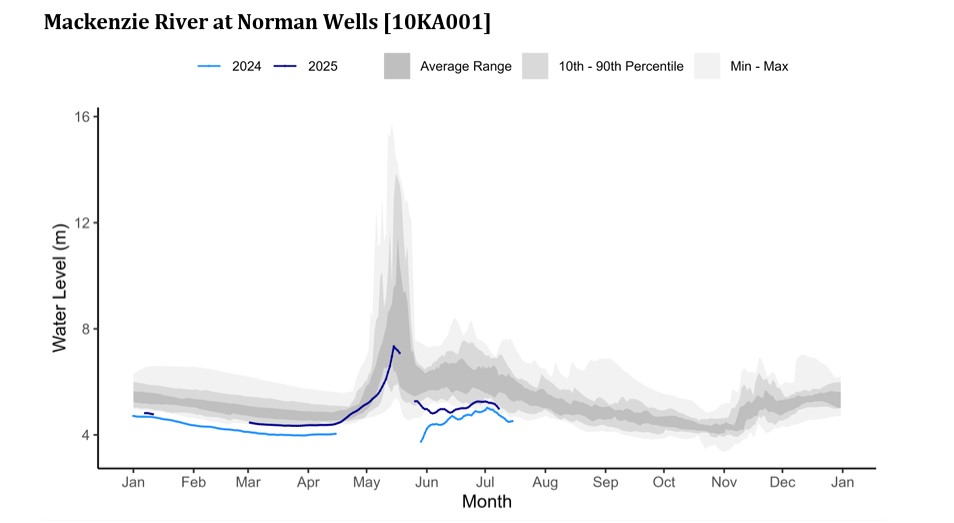
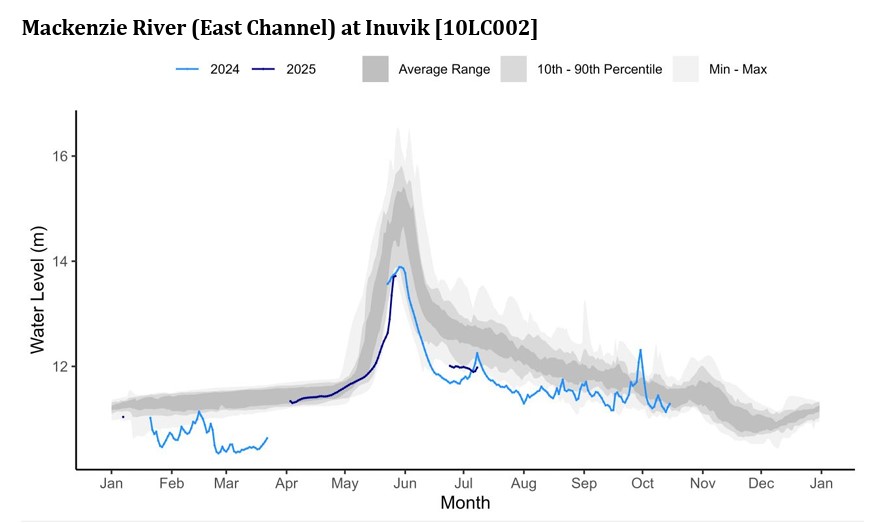
Other water bodies with levels well below average include the Slave River, which is at a similar level compared to this time last year, and the Mackenzie River.
Advertisement.
Advertisement.
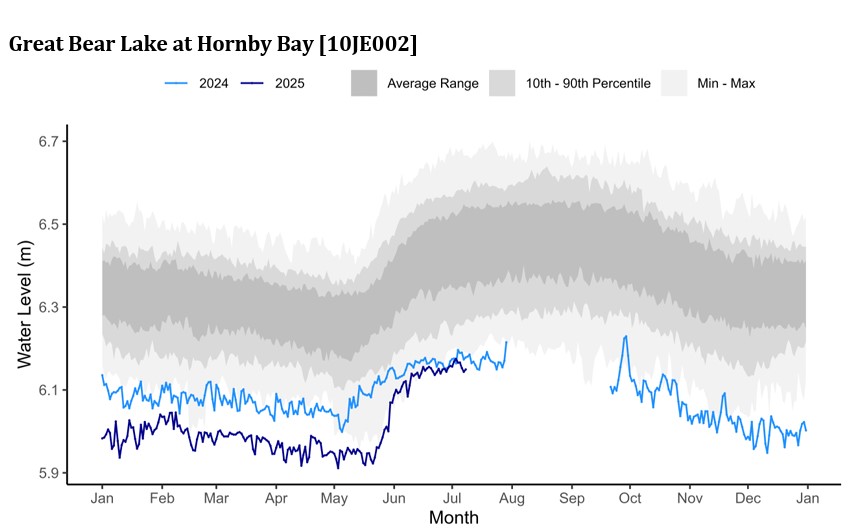
The water level of Great Bear Lake is at its lowest on record for this time of year, the NWT government said, while the water level of Liard River is below average for this time of year.
Some rivers above average
There are some rivers in the NWT that are not experiencing low water.
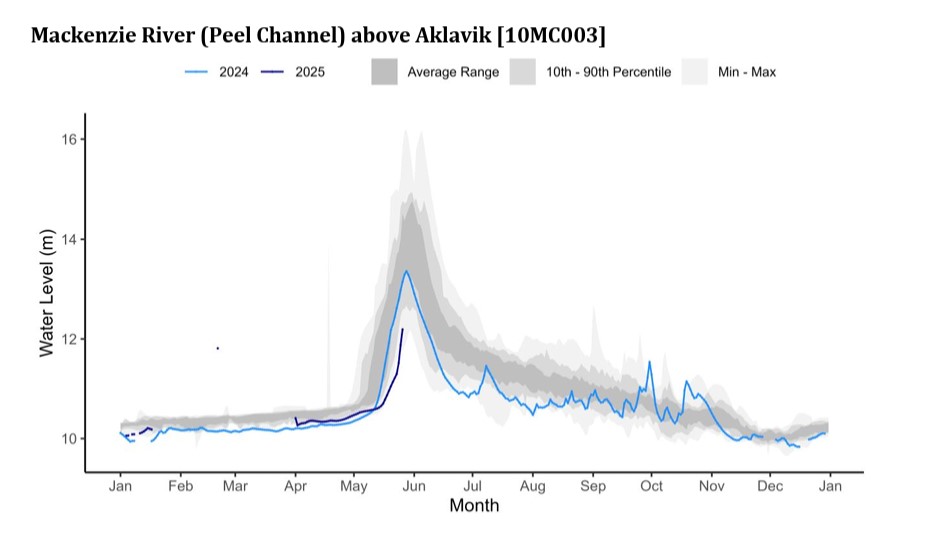
That includes the Peel, South Nahanni, Snare and Hoarfrost rivers, which are at average levels and flows. Meanwhile the Taltson and Lockhart rivers are above average and the Tazin River is well above average.
The territory said while water levels have shown some recovery since extreme drought conditions began in 2022, that has been largely limited to smaller rivers and lakes.
Advertisement.
Advertisement.
According to the water monitoring bulletin, precipitation in June was below average across the territory.
The NWT government said temperatures during the month were cooler than average in Fort Smith, average in Hay River, Norman Wells and Yellowknife, and warmer than average in Fort Simpson and Inuvik.
The amount of rainfall in northern Alberta and British Columbia is expected to impact water levels on Great Slave Lake and Mackenzie River for the rest of the summer. So far this spring and summer, the bulletin states precipitation in those areas has been below to well below average.
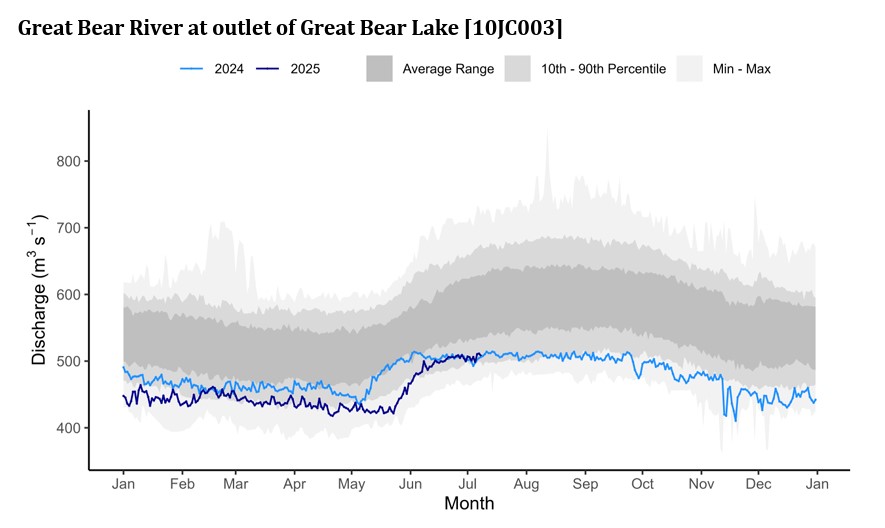
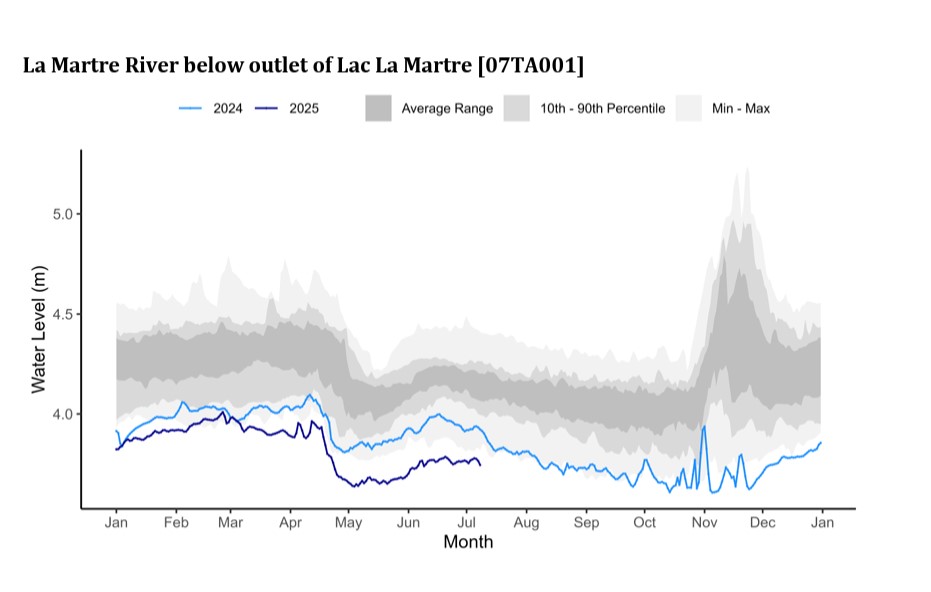
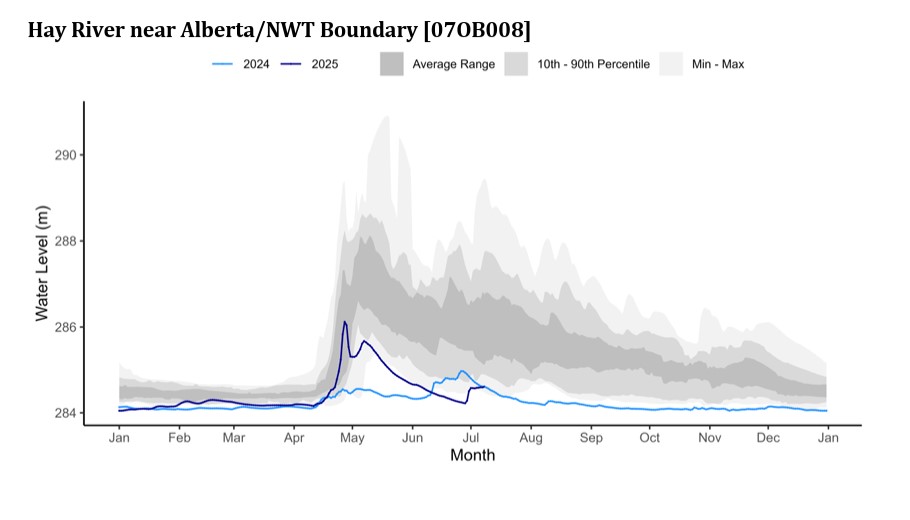
Tracking water levels and flows
In the following graphs, which were shared in the bulletin, the light blue line indicates water levels and flows from 2024 while the dark blue line shows this year’s water levels and flows.
The darkest grey band shows the average range, the medium grey band shows where an outlying year might land, and the lightest grey represent the highest and lowest levels or flows on record.
You can find graphs for more water bodies and other information in the water monitoring bulletin.