


Advertisement.
Yellowknifers’ social channels have been awash in screenshots this week. -39C seemed cold enough, but Wednesday morning brought a fresh low of -44C.
Chilly residents have been sharing those values with the world.
Other parts of the territory have had it worse this winter, and some regions like the Sahtu have faced much longer spells of brutal cold.
Even so, Wednesday morning’s low of -44.3C (at 2am) was the territorial capital’s coldest moment since February 2021.
Advertisement.
Advertisement.
After an unusually warm fall, winter in Yellowknife has felt much more… wintry. There’s even been a reasonable amount of snow. So how does this winter stack up against others, and what’s the possible impact on the territory’s years-long drought?
The latest NWT water monitoring bulletin, issued last week, compares air temperature and precipitation to the historical record for various communities – and assesses the bigger picture from a water perspective.
Here are the bulletin’s charts for Yellowknife.
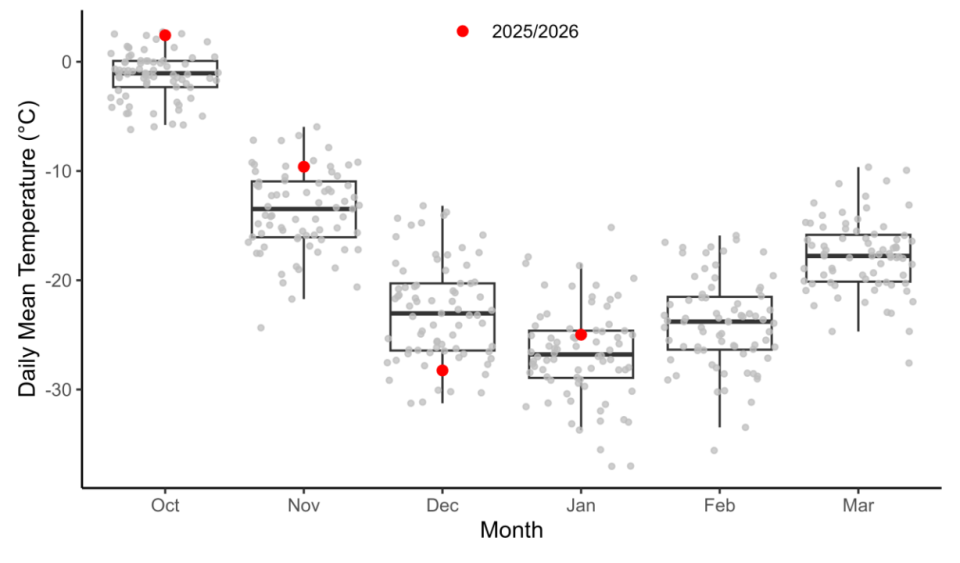
First is the air temperature chart. This shows the daily average temperature in the city for each month starting in October last year and stretching through to January – that’s the red dots.
Advertisement.
Advertisement.
The thick black horizontal line with the box around it shows where you might expect a normal month to fall based on the overall record.
This chart reflects the warmth of fall – October and November were both warmer than average – and the plunge into an unusually cold December. January was a little warmer than average but not by much.
Now let’s look at precipitation (rain and snow) for the same period.
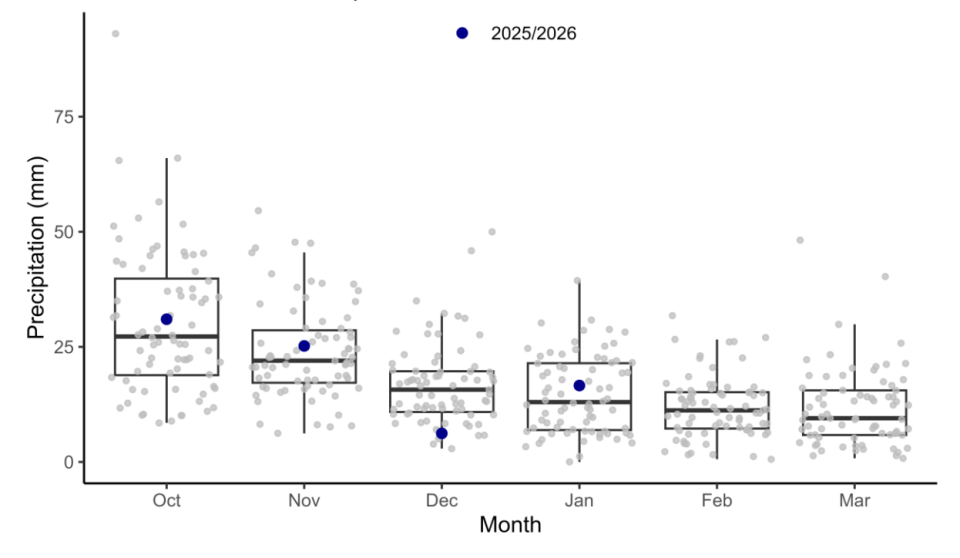
With the exception of quite a dry December, precipitation has been a little above average in Yellowknife this winter – and this doesn’t count several pretty large dumps of snow the city has received in February.
For example, data from Yellowknife’s airport suggests the amount of snow on the ground has increased from 52 cm to 74 cm this month so far. (That’s actually a record for the amount of snow on the ground in Yellowknife in mid-February, though measuring snow on the ground remains trickier than many other weather-related things we measure.)
The temperature pattern is broadly similar in Hay River, Fort Smith and Fort Simpson. You can view charts for those communities in the GNWT’s full bulletin, alongside data for Norman Wells and Inuvik, where December was more in line with historical averages.
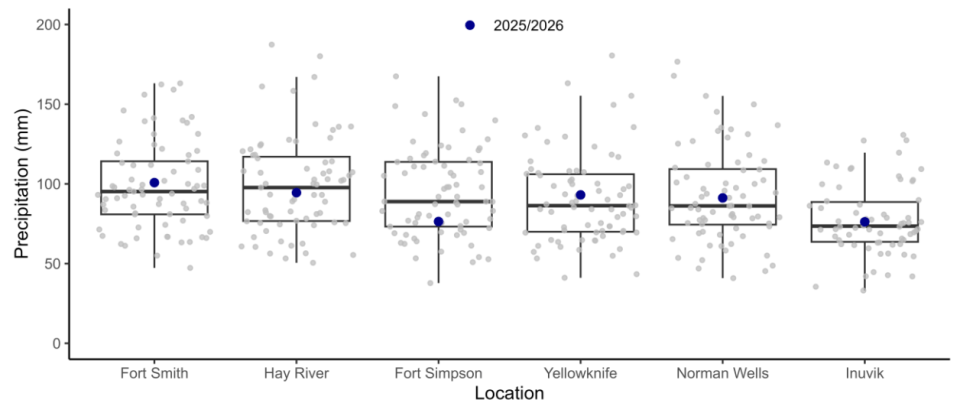
This chart shows precipitation across those NWT communities so far this winter. With the exception of Fort Simpson, precipitation is about average.
However, an important place to look in terms of the NWT’s drought is the region of northern Alberta and BC that feeds into the territory’s river systems.
Advertisement.
Advertisement.

This map shows, in grey, the southern areas that form the Slave River basin and send water north into Great Slave Lake and beyond.
The GNWT tracks precipitation in these areas, too, since that has an effect on the amount of water flowing into the territory via the Slave River.
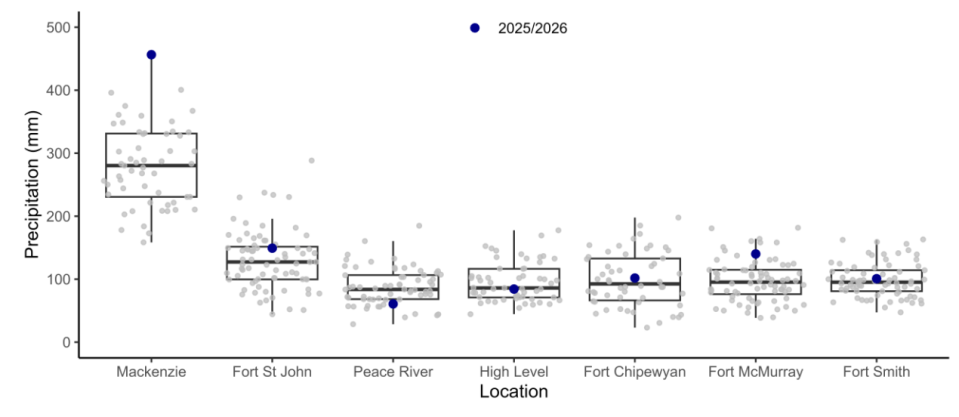
This winter’s precipitation value for the station in Mackenzie, BC, in particular, is high.
“Water levels on Great Slave Lake and the Mackenzie River are strongly influenced by precipitation received in northern British Columbia and Alberta,” the GNWT’s water monitoring bulletin states.
“So far this early winter, precipitation in these areas has been average to well above average, and the headwaters of the Peace River have received record high cumulative precipitation.”
That doesn’t mean the drought that began in 2022 will necessarily end soon, but it could mark a shift in the underlying picture.
“March is forecast to be cooler than average across the territory, followed by a return to near-normal temperatures in April. Precipitation is forecast to be average to above average across the territory,” the bulletin added.
For now, the drought remains firmly in place.
“Water levels and flow rates are very low across most of the NWT,” the bulletin stated. Those levels have shown only “limited recovery” since 2022.
Great Slave Lake’s water level is still well below average and essentially where it was this time last year. The Mackenzie, Hay, Liard and Slave rivers are all below their average levels.